How to build a web app with Streamlit


In this blog post I want to show how easy it is to build a web application with Streamlit and then use Heroku to deploy it and make it accessible for everyone. For this small web-app, I want to detect blobs in a given image. Furthermore, I want to be able to fiddle around with the parameters within the model and see the results immediately on the webpage. So let's first start with building our python program to detect blobs.
For this, we will make use of opencv-python, which already has a class with which we can detect blobs in images: the SimpleBlobDetector
import cv2

blob_params = cv2.SimpleBlobDetector_Params()
blob_params.filterByInertia = False
blob_params.filterByConvexity = False
blob_params.filterByColor = True
blob_params.blobColor = 0
blob_params.filterByCircularity = True
blob_params.filterByArea = False
blob_detector = cv2.SimpleBlobDetector_create(blob_params)
These are some of the parameters the class has got. Next, we fetch an image and use the algorithm to detect the biggest blob detected.
keypoints = blob_detector.detect(openCVim)

# find largest blob
if len(keypoints) > 0:
    kp_max = keypoints[0]
    for kp in keypoints:
        if kp.size > kp_max.size:
            kp_max = kp
And that's pretty much it. openCVim will be the input of our model, and kp_max the keypoint with the biggest size. What we need now is streamlit to easily create a webpage which will use this model.
import streamlit as st

st.write("""
# Simple Blob Detection App
Upload your image and see where the Blob is!
""")

st.sidebar.header('User Input Parameters')
It's that easy. We created a header for our webpage and a sidebar with a different header. In this sidebar, we want to be able to fiddle around with some of the blob_params.
def user_input_features():
    minCircularity = st.sidebar.slider('minCircularity', 0., 1., 0.8)
    minArea = st.sidebar.slider('minArea', 0, 1, 10)
    maxArea = st.sidebar.slider('maxArea', 0, 1, 100000)

    data = {'minCircularity': minCircularity,
            'minArea': minArea,
            'maxArea': maxArea}
    features = pd.DataFrame(data, index=[0])
    return features


df = user_input_features()

blob_params.minCircularity = df.minCircularity.values.item()
blob_params.minArea = df.minArea.values.item()
blob_params.maxArea = df.maxArea.values.item()

st.subheader('User Input parameters')
st.write(df)
We defined a function, which uses streamlits sidebar.slider function. The first value is the lowest value the slider can be, the second the largest value the slider can be and the last value is the default value. We then use these values to create a dataframe, which we use to fill the blob_params. So each time the user changes one of the values via the slider, the model get's a different parameter input and will automatically rerun the model. With st.subheader we give a subheader and then show the dataframe to the user with the chosen parameters.
uploaded_file = st.file_uploader("Choose an image...", type="jpg")
if uploaded_file is not None:
# Read in and make greyscale
PILim = Image.open(uploaded_file).convert('L')
# Make Numpy/OpenCV-compatible version
openCVim = np.array(PILim)
openCVim = cv2.bitwise_not(openCVim)
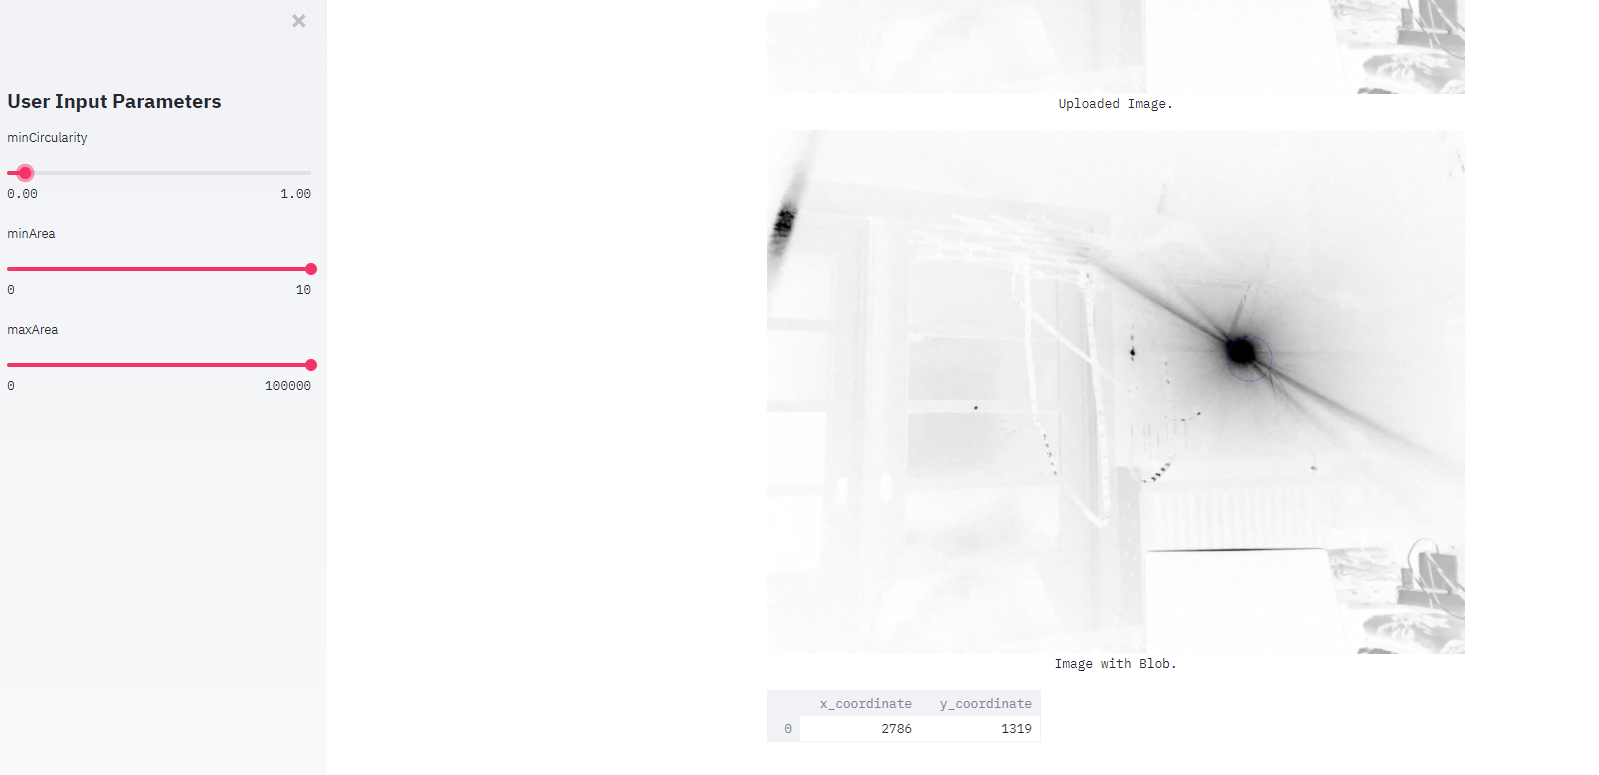
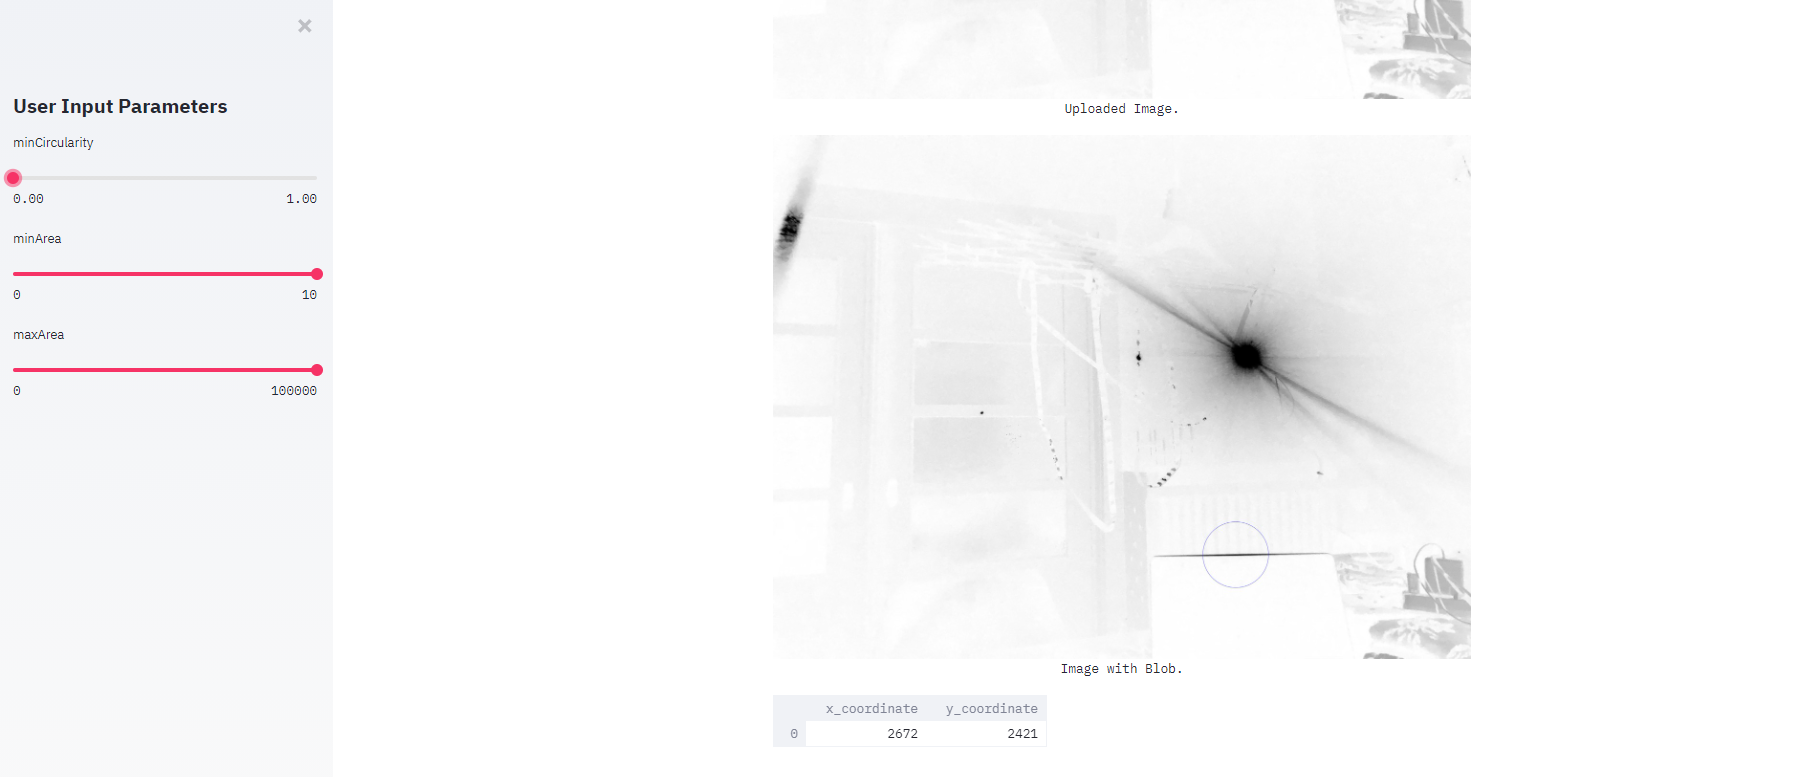
st.image(openCVim, caption='Uploaded Image.', use_column_width=True)
Next, the user should upload an image. Only when this file is not None we will proceed with our modeling. We read the image in with PIL, put it to grayscale (in my experience for blob-detection that worked better) and transform it to an numpy array, which cv2 needs to create the model.
keypoints = blob_detector.detect(openCVim)

# find largest blob
if len(keypoints) > 0:
    kp_max = keypoints[0]
    for kp in keypoints:
        if kp.size > kp_max.size:
            kp_max = kp

pts = np.array([kp_max.pt])

data_coordinates = {'x_coordinate': int(pts[:, 0]),
        'y_coordinate': int(pts[:, 1])}
df_coordinates = pd.DataFrame(data_coordinates, index=[0])

im_with_keypoints = cv2.cvtColor(openCVim,cv2.COLOR_GRAY2RGB)
#     im_with_keypoints = cv2.circle(openCVim, (int(pts[:, 0]), int(pts[:, 1])), 50, color=(0,255,0), thickness=30, lineType=8, shift=0)
im_with_keypoints = cv2.drawKeypoints(im_with_keypoints, [kp_max], np.array([]), (0,0,255), cv2.DRAW_MATCHES_FLAGS_DRAW_RICH_KEYPOINTS)

st.image(im_with_keypoints, caption='Image with Blob.', use_column_width=True)

st.write(df_coordinates)
Still in the if statement we progress by building the model, get the biggest blob and get the coordinates by calling kp_max.pt. We store these values in a dictionary to put it in a dataframe, which we show at the end of the page. We also use the coordinates to mark the calculated keypoint. Finally, we return the image with a circle around the detected image to the user.
And that's it, we build a fully functional web-app with streamlit. Finally, we want to deploy it on Heroku. After creating an account it should look something like this:
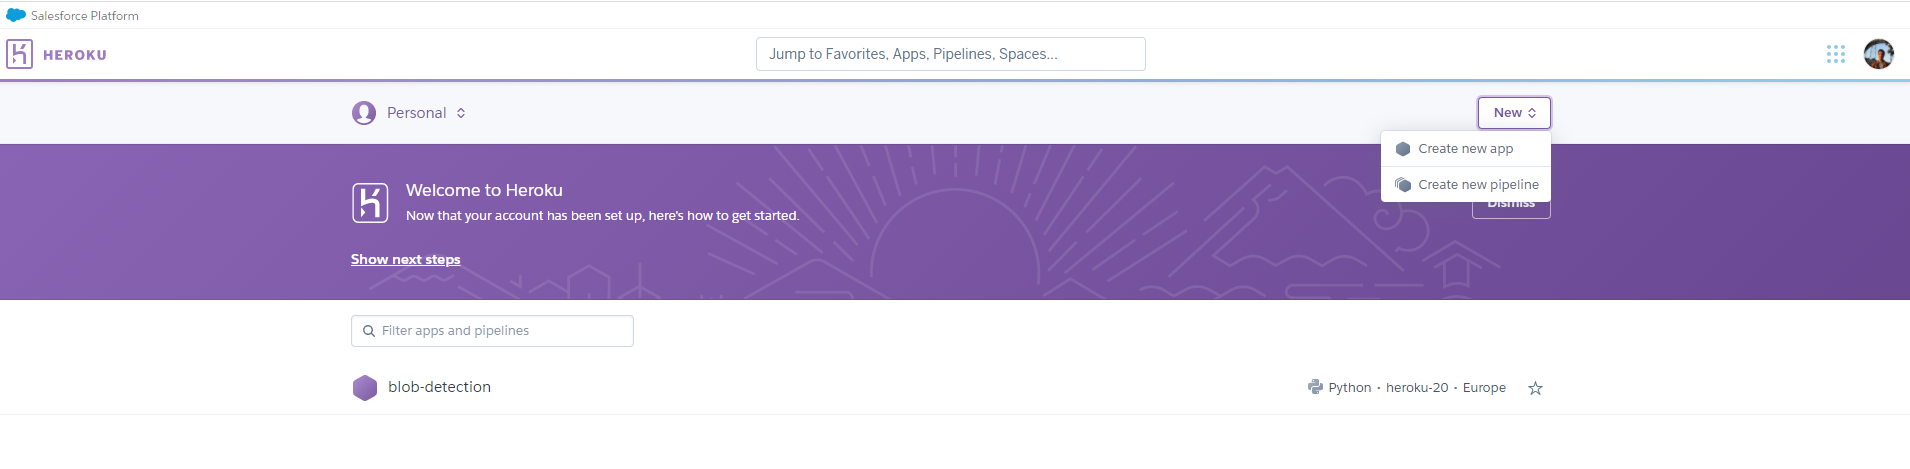
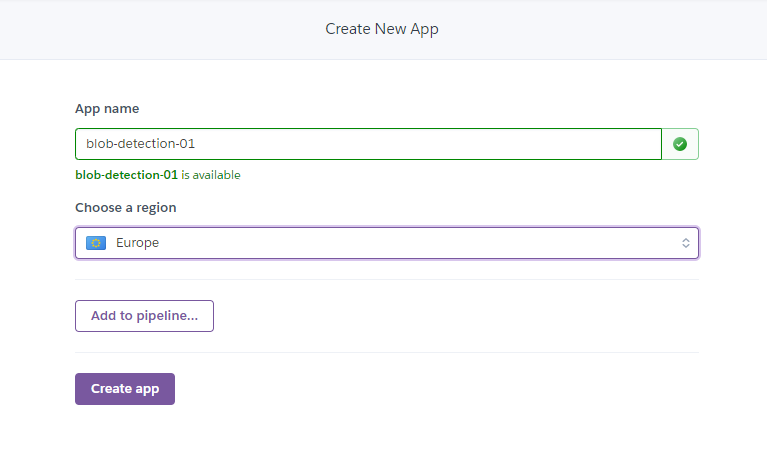
Click on "Create new App".
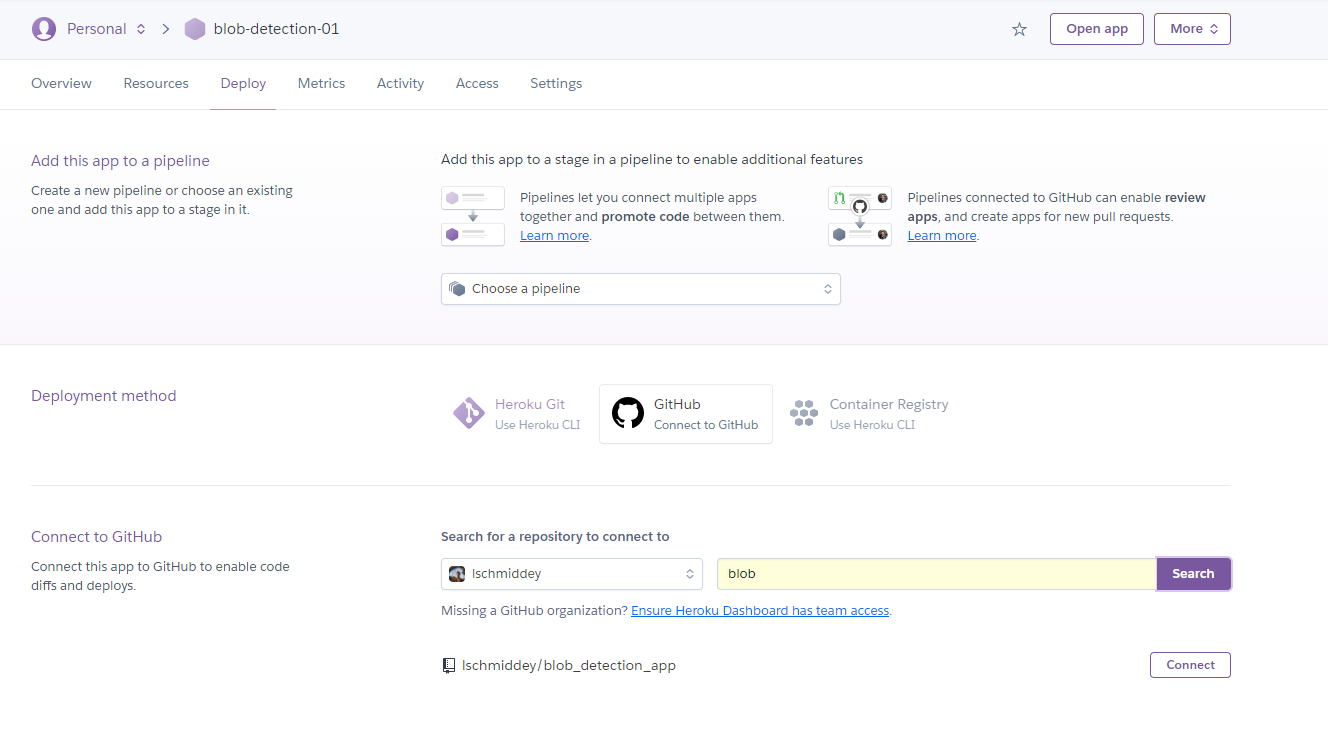
Use your git-repository to let Heroku deploy the web-app for you, click on connect and your done! It's that easy. Heroku requires three more files in your repository:
⋅⋅ requirements.txt, where you specify the packages you use and the respective version ⋅⋅ Procfile, which tells Heroku how to start the Streamlit-app ⋅⋅* setup.sh, which is a shell script which tells the Heroku server how to deploy the Streamlit-app
Simply check out my git repository for an example.
After all is said and done, this is how the app looks like:
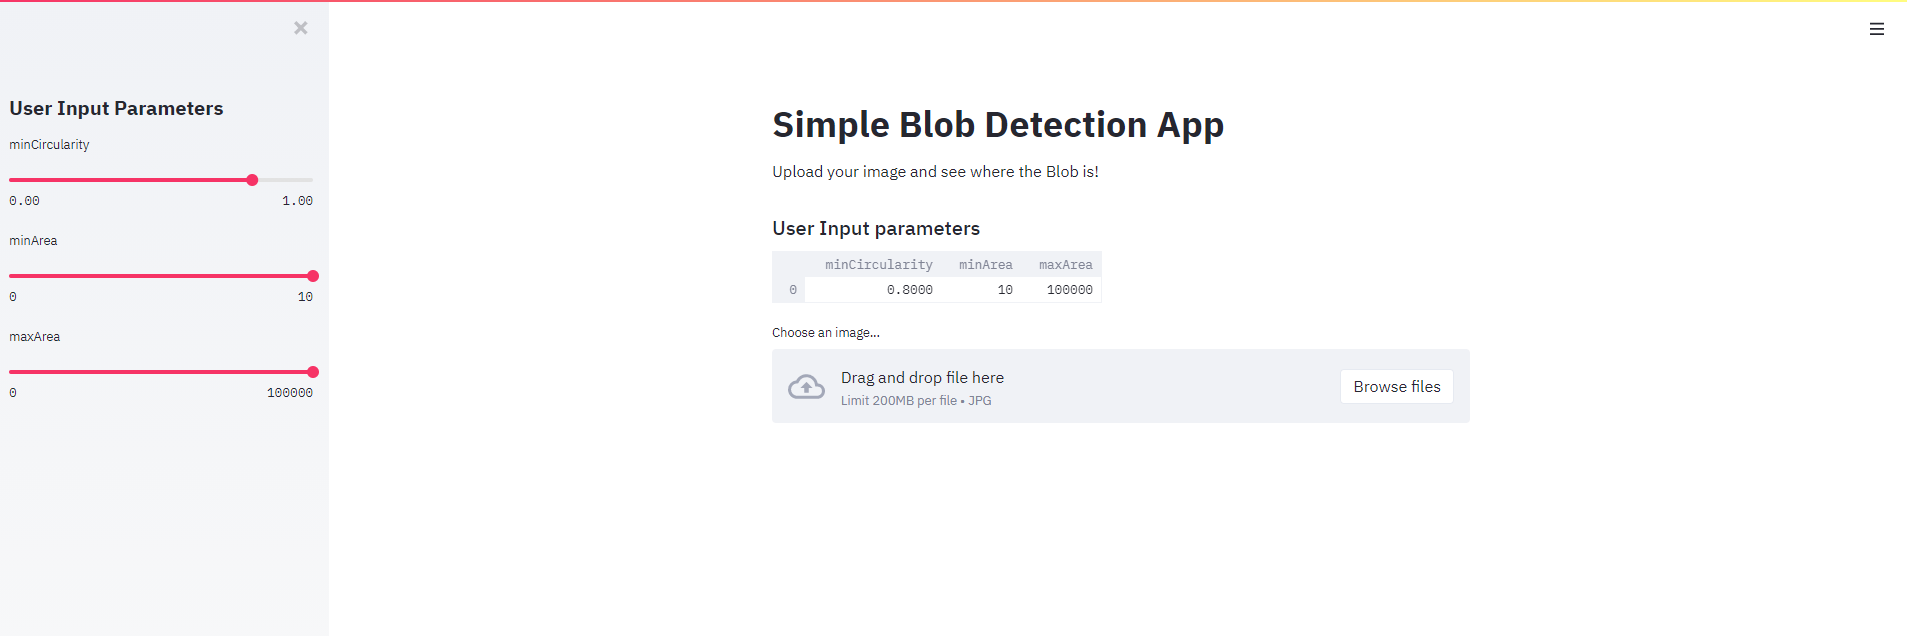
Or simply check out the web-page.
I hope you enjoyed this post and stay tuned for the next one.
Lasse